Stationary at the top of
all company pages is a quick Company Summary with easy to find basic details
and a ![]() to add the company to your Company Analysis List.
to add the company to your Company Analysis List.
·
Address
·
Phone
·
Fax
·
Company Website
·
Incorporated (Date)
·
IRS Number
·
CUSIP
·
Legal Counsel
·
Transfer Agent
·
Sector
·
Industry (SIC)
·
Industry (NAICS)
·
Number of Employees
·
Number of Shareholders
·
Market Cap
·
Revenue
·
Net Income
·
Dividend
·
Dividend Yield
·
EPS Basic
·
EPS Diluted
·
PE Ratio
Search – Click this tab button
to return to the Basic Search page.
Search Results –
Click this tab button to return to the Search
Results list of your most resent search.
Synopsis – Pending…
Change Company –
If you would like to search for another company by name quickly, but do not
want to return to the search pages, simply type the company’s name or ticker
symbol into the text box. A window will
automatically display as you type to show you the matches available for the
letters or names you type. Click on a
specific company to go directly to that company’s page.
Recent Companies – Click on the drop down menu to access a list of recently viewed
companies listed by their ticker symbols and exchanges. Click on any of the names in the list to
quickly return to that company’s page.
Equity
Pricing
This Section displays
the equity pricing information in chart format. Controls are available to
reformat the chart to view pricing information over a specified time period and
frequency. The ability to display prices for up to four other companies as
compared to the target company is also available in this section.
Note: 5, 10, 15, & 20+ years of pricing history
is available depending on what your subscription to this data module entitles
you to.
- Chart
Controls
By default the chart in this section displays the past three years of daily pricing information for the company being viewed.
o Controls Section - This section is used to reformat the period and
frequency of pricing information that is displayed. Note: After each change
in this section the chart will be refreshed. It is unnecessary to click the
Draw Chart button.
- Select the History: There are two ways to select the
period displayed on the charts:
- Time Period
- Use the drop-down menu to choose the number of years history that is
displayed on the chart. You may
choose a time period from 1 week to 30 years.
- Date From
- Enter
the start and end dates in the fields provided to display a specific
time period. You can use the calendar icon (
 ) to open a
pop-up window with a calendar to click on the date you wish to select. Clicking
in the text field will automatically drop down a calendar from which
you can also select dates.
) to open a
pop-up window with a calendar to click on the date you wish to select. Clicking
in the text field will automatically drop down a calendar from which
you can also select dates.
Note: Dates must be entered in the format: MM/DD/YYYY. - Select
Frequency - Choose the option button
next to the desired frequency. Daily, weekly, or monthly price
frequencies are available.
- Additional
Options:
- Show Grid
- Choose whether or not a grid is shown in the charting area.
- Show Unadjusted Prices - Choose whether or not
unadjusted prices are displayed in the charting area.
- Show
Splits – Choose whether or not
price splits are displayed in the charting area.
- Dividends
Paid – Choose whether or not
dividends paid events are displayed in the charting area.
- Index
Comparison
Use this section to add an Index or Sector price line to the chart of the target company. These comparisons can be used in conjunction with the Company Comparison. - Select the check box next to Index.
- Use the Drop down menus to select the desired Index
to be displayed on the chart.
- Click on the Draw Chart button the bottom of
the page to display the index line on the chart.
- Company
Comparisons
This section is used to add up to four other companies to the chart for comparison to the target. Note: Once Comparison companies are added and the chart is redrawn the chart defaults as being rebased to 0. Once rebased, the chart displays price changes for each company, not actual prices. - Start with Company 1 and click the check box
to select it.
- As you begin typing either the company’s name or
ticker symbol in the text box, a list of matching companies will
display.
- Select the appropriate company from the result window
and that company will be added to the Company 1, Name field.
- Up to four companies may be included for comparison
on the chart by repeating the above steps using the available company
comparison positions.
- To add these comparison companies to the Company
Analysis List, click the Add
these chosen companies to the Company Analysis List link.
- Click on the Draw Chart button at the bottom
of the page to display comparison company’s lines on the chart.
- Type
When the charting tab is first accessed the chart is rebased to price. When another company, Index line is added the chart is then rebased to 0. - Rebase to
- Select how the chart is rebased. When rebasing the chart to either 0
or 100 all the companies prices being compared will begin at 0 or 100
respectively.
The price lines of the comparison companies are then displayed as a percentage change compared to the target company instead of the actual trading price. After selection is made, click on the Draw Chart button. - Inc. moving average
(Include moving average) - Check this box off and enter the number of
days for the moving average of the target company to be displayed on the
chart. After selection is made, click on the Draw Chart button.
- Report
Controls
By default the table in this section displays the past three years of daily pricing information for the company being viewed. If the time period and frequency were changed in the Chart section first, those changes will be kept when viewing the report.
o Controls Section - This section is used to reformat the period and
frequency of pricing information that is displayed. Note: After each change
in this section the chart will be refreshed. It is unnecessary to click the
Draw Chart button.
- Select the History: There are two ways to select the
period displayed on the charts:
- Time Period
- Use the drop-down menu to choose the number of years history that is
displayed on the chart.
- Date From
- Enter
the start and end dates in the fields provided to display a specific
time period. You can use the calendar icon () to open a
pop-up window with a calendar to click on the date you wish to select. Clicking
in the text field will automatically drop down a calendar from which
you can also select dates.
Note: Dates must be entered in the format: MM/DD/YYYY. - Select
Frequency - Choose the option button
next to the desired frequency. Daily, weekly, or monthly price
frequencies are available.
- Click on the Refresh button to display the
report with the changes that were made.
- Additional
Options:
- Show Unadjusted Prices - Choose whether or not
unadjusted prices are
o Historical Pricing - This section displays the report information for
the target company. The Date, Open, High, Low, Close
Prices are shown followed by the Volume and Percent move.
- Select the History: There are two ways to select the
period displayed on the charts:
- Time Period
- Use the drop-down menu to choose the number of years history that is
displayed on the chart.
- Display Options –
You may choose to display prices in ascending or descending order by
date by clicking on the dark blue headline in the date column. Note
that a small white arrow will indicate the direction of data movement.
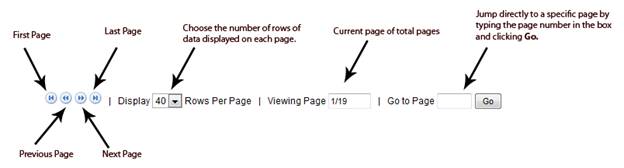
- Navigating
between Report Pages
Within a large amount of pricing information the page navigation buttons can be used to move between the multiple pages. You can move to the first page, last page, next page, previous page or directly to a particular page, as indicated in the diagram:
At the right of each
page is the My Mergent Tools function. This enables you to add the
currently selected company to the Company Analysis List or add executives to
your Executive List. From the My Mergent Tools buttons you may also access the
Company and Executive Alerts options.
See My
Mergent Tools for
more details of these. Where
appropriate, each page also features a link which will allow you to download
the data available on that page into a Microsoft Excel spreadsheet or opens a
printer friendly page so that you may print the page directly.